

Prerequisites
Before you can debug apps with Vega Studio, complete these setup requirements to ensure your development environment and target devices are properly configured.- (Optional) Review the VS Code debugging documentation.
- (Optional) Learn about GDB (GNU Debugger).
- Choose your debugging target: Vega Virtual Device or Fire TV Stick.
-
Enable developer mode for your target:
Vega Virtual Device
- Open VS Code.
- Select the Vega Studio extension icon from the activity bar.
- Navigate to Devices.
- Start the Vega Virtual Device.
- Open a terminal and run:
Fire TV Stick- Connect your Fire TV Stick to your development machine through USB.
- Enable developer mode following Run your app on Fire TV Stick.
Configure the Vega Studio debugger
Set up debugging configurations to specify how Vega Studio should launch and connect to your app. You can use automatic configuration for quick setup or manual configuration for custom debugging scenarios.Automatic configuration
- Open your project file or select it from the sidebar.
-
Choose Run and Debug from the VS Code activity bar.
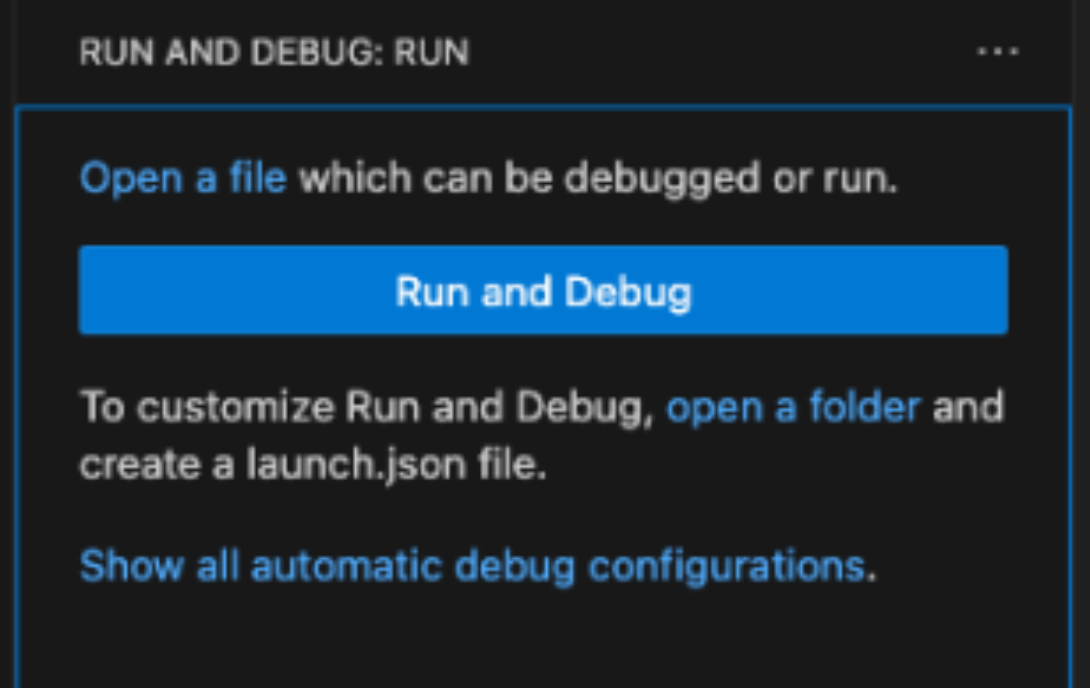
-
Select the debugger type:
- Vega: For React Native for Vega apps (JavaScript/TypeScript code)
- Vega Native: For Turbo Modules (native C++ code)
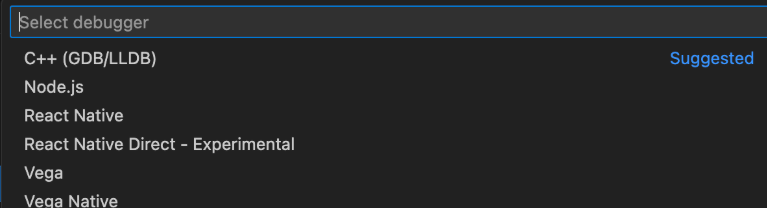 The debugger attaches to the running app.
- Follow the steps in Debug your app.
Manual configuration
- Go to Run and Debug in the VS Code activity bar.
- Click create a launch.json file.
- Select a project from the prompt (skip if you only have one project).
-
Select the debugger type:
- Vega: For React Native for Vega apps (JavaScript/TypeScript code)
- Vega Native: For Turbo Modules (native C++ code)
Specify your target device
When multiple devices are connected, specify your target device by setting thedeviceId property:
"${command:kepler.state.getSelectedDeviceId}"- Uses device selected from the sidebar"KeplerVirtualDevice"- Targets Vega Virtual Device specifically- Device serial ID - Targets specific physical device
Add configuration to launch.json
To add additional configurations to an existing launch.json file:- Open your app’s launch.json file.
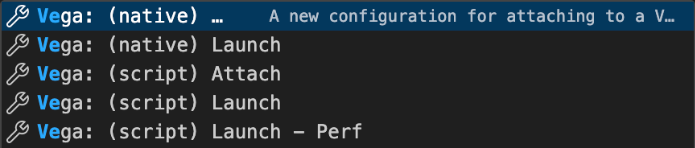
- Select the Add Configuration button.
- Choose your desired launch target from the available options.
-
Save your changes.
Set up breakpoints
Create breakpoints in your app by clicking in the left margin of the code editor next to line numbers.
Launch.json attributes
Sample configurations
Basic React Native for Vega appConfiguration snippets
Debug your app
Once you’ve configured your debugger and set up breakpoints, start debugging your app on your chosen target device. The debugging process is similar for both devices, with device selection being the main difference.Debug on Vega Virtual Device
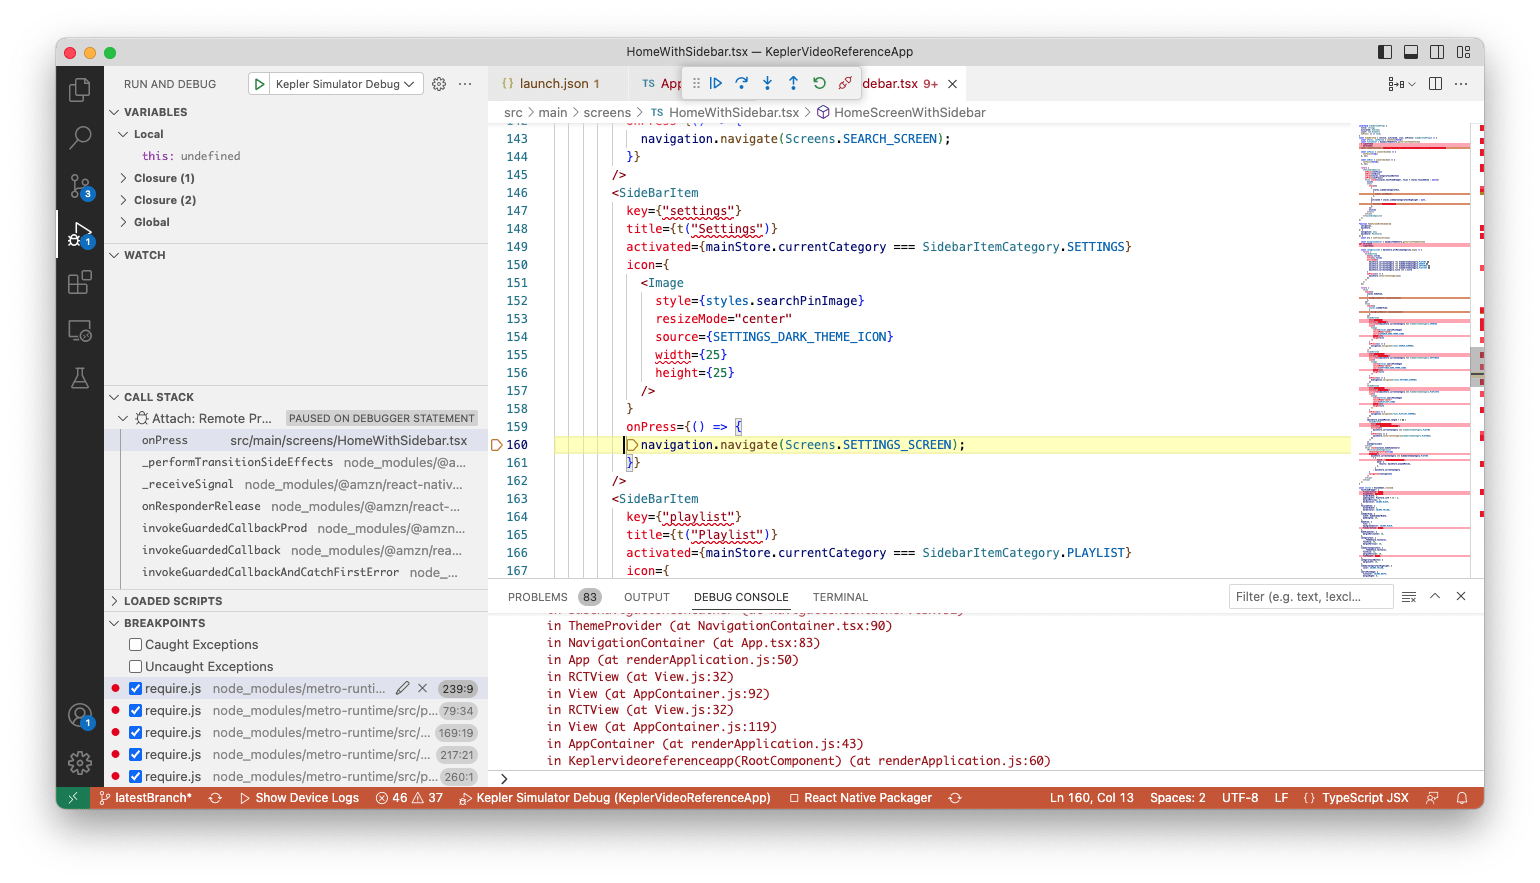
- Select Virtual Device from the sidebar.
- Go to Run and Debug.
- Select the (script) Launch config from the dropdown.
- Click the play icon or press F5.
Debug on Fire TV Stick
- Select Fire TV Stick as your target.
- Go to Run and Debug.
- Select the (script) Launch config from the dropdown.
- Click the play icon or press F5.
Debug toolbar actions
The debug toolbar contains actions you can perform during a debugging session.
